Lab 8: Image Formation by Thin Lenses
Archie Wheeler
Arnold Chand
03.12.2012
A pdf version of this lab may downloaded here.
The doc version of this lab may be downloaded here.
Abstract
In this lab, we investigated the relationship between the distances of an object and an image from a thin lens. We found the lab to be challenging, and had a lot of difficulty getting good enough data to get accurate results. We had massive error, mostly due to difficulties in getting accurate and precise measurements. In the end, I do not feel that our results were convincing enough to prove the relationships this lab was intending to prove.
Contents
Objectives
- To observe the relationship between the distances of an object and an image from a thin lens.
Methods
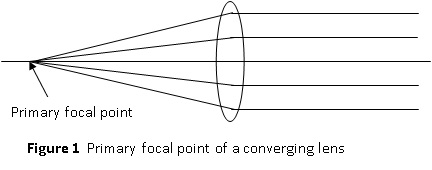
Part 1. Determining focal length directly
We directed a lamp at the front table towards our lab station, a distance of about 6 meters, and positioned a 13 cm converging lens onto the track. We then put a prism screen on the track behind the lens and adjusted the distance until the image came into focus. We recorded the values xL and xS and compared the distances between the two. abs(xL-xS) should be close to the focal length.Part 2. Real Object Converging Lens Setup
We set up our lamp so that it was placed directly behind our object candles. We then placed our lens at distances of 80cm, 50cm, 30cm, 20cm and 18cm and found the image distance. We constructed a graph of 1/p and 1/q, and determined the focal length by taking the inverse of the y-intercept.
Afterwards, we placed the image screen at 72cm behind the object and found the two points that the lens could be placed to get a sharp image.
Part 3. Virtual Object Converging Lens
We placed the prism screen at a position of 70cm behind the collated light source. We moved the 58cm lens until it was at a position that created a virtual object at 70cm for the 13cm lens. Then, we placed the 13cm lens at positions of 35cm, 40cm, 45cm, 55cm, and 60cm. By plotting a graph of 1/q vs. 1/p, we found out the power of the lens. Also, we created a graphical solution for the -.35m object by tracing three rays.
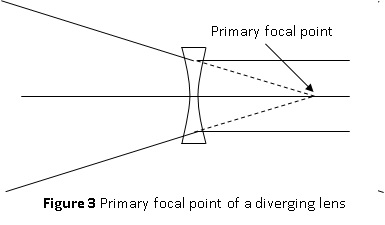
Part 4. Virtual Object Diverging Lens
Keeping the 58cm lens at its position, we swapped out the small converging lens with a diverging lens and positioned the lens carriage between the large lens and the virtual object. At positions of 66cm, 65cm, 64cm, 62cm, and 60cm, we found the positions for the image. By plotting a graph of 1/q vs. 1/p, we used the y-intercept to find the power of the lens.
Setup
Materials:- Optical bench
- Light bulb source, ground glass object, prism screen
- Four optical bench carriages
- Collimated light source
- Converging achromatic lenses with focal lenghts of about 13 cm and 60cm.
- Diverging lens with focal length of about 15 cm
- Graphical Analysis software


Data and Analysis
Part 1. Determining focal length directly
xL=44.8cm
xS=58.9cm
abs(xL-xS)=14.1cm
f=13cm
%Error = 8.46%
Whether or not the image was in focus was a subjective call on our part. There would have been ample error here for experimental error, especially over such a small distance
Part 2. Real Object Converging Lens
| xlens(p)(cm) | ximage(cm) | q(cm) |
|---|---|---|
| 80 | 96.5 | 16.5 |
| 50 | 68.5 | 18.5 |
| 30 | 54.1 | 24.1 |
| 20 | 57.6 | 37.6 |
| 18 | 66.3 | 48.3 |

Real Object, Converging Lens
Slope = -1.115
Slopeexpected=-1.000
%Error=11.5%
y-intercept=.07592/m
(y-intercept)-1=13.17cm
power=13cm
%Error=1.32%
4f=52cm
p+q=72cm
When the image is at 72cm, then the lens will focus at positions 53.6cm and 17.3cm
 This equation will have two real solutions when C>4.
It is possible that the position of the lamp may have had some bearing on where the image appeared. We tried to make the lamp as close as possible to the object, but they could not, for obvious reasons, occupy the same space. Also, the determination of when something is in focus is somewhat subjective and could have been a source of error.
Part 3. Virtual Object Converging Lens
| xlens(cm) | ximage(cm) | p(cm) | q(cm) |
|---|---|---|---|
| 35 | 44.3 | -35 | 9.3 |
| 40 | 48.7 | -30 | 8.7 |
| 45 | 53.7 | -25 | 8.7 |
| 55 | 61.9 | -15 | 6.9 |
| 60 | 65.4 | -10 | 5.4 |

Virtual Object, Converging Lens
Position of 58cm lens = 13.5cm
Slope = -1.079
Slopeexpected=-1.000
%Error=7.9%
y-intercept=7.554/m
(y-intercept)-1=13.23cm
power=13cm
%Error=1.77%

Graphical solution
This is a ray trace for a -.35m lens. The geometry was determined by the equation, and not the actual diagram. Our value of 9.3cm only varies from 9.48cm by 1.9%
Our percent error in this part is comparably small to some of the other error in other sections. I believe this may be partially due to the fact that we had larger distances in this section. When one is taking measurements over a long distance, an error in a few millimeters is not as serious as when its over small distances.
Part 4. Virtual Object Diverging Lens
| xlens(m) | ximage(m) | p(m) | q(m) | 1/p(1/m) | 1/q(1/m) |
|---|---|---|---|---|---|
| 0.66 | 0.722 | 0.04 | 0.062 | 25.000 | 16.129 |
| 0.65 | 0.734 | 0.05 | 0.084 | 20.000 | 11.905 |
| 0.64 | 0.740 | 0.06 | 0.100 | 16.667 | 10.000 |
| 0.62 | 0.765 | 0.08 | 0.145 | 12.500 | 6.897 |
| 0.60 | 0.798 | 0.10 | 0.198 | 10.000 | 5.051 |
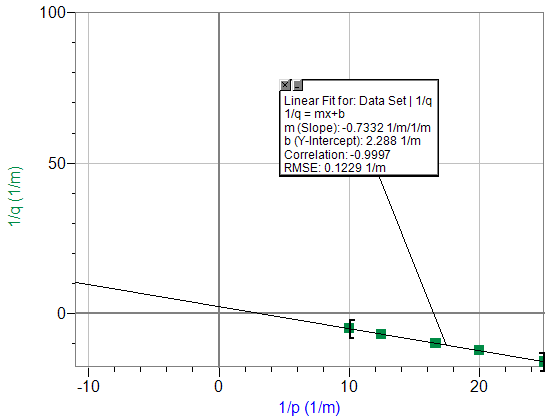
Virtual Object Diverging Lens
Position of 58cm lens = 13.5cm
slope=-.7332
slopeexpected=-1.000
%Error = 27.7%
y-intercept=2.288
(y-intercept)-1=.43m
power=0.70m
%Error=38.6%
Most of the distances between p and q in this part of the experiment were very small. The difference of a few millimeters would have made a large difference when determining %error. If the position of the virtual image was off by a small amount, or if the lens had been bumped and the image had moved, it would have caused a consistent error in our graph. It is also possible that one of the lenses may have had a mislabeled calibration, which would also shift the image or virtual object.
I did not feel like this lab was that much of a success. While we followed instructions, we had difficulty getting accurate values from our graphs. We were able to consistently find images, but our measurements for these images frequently wreaked havoc on our analyses.
There were many sources of error in this lab, as one can obviously see from our huge %error. While part of it was due to our own confusion with some parts of the lab, other sources included a lack of accuracy in taking measurements. Especially in part 4, when the image and the object were so close together, a difference in a few millimeters as to where we feel the image would have caused a huge percent error. Also, it is possible that the lenses we were using were not directly over the position indicated by the carriage. The lenses were not infinitely thin, and so there was a little aberration from where the equations would predict the ideal image.
If this lab were to be improved, I would expand the setup to include measurements that were not so close together. More time in lab for sections that we did not get the best data for would have also been nice. I know that our equipment is good enough to get excellent results, but I have a feeling that getting the excellent results may take a little practice for people who do not use lenses in everyday life.
Signature

Archie Wheeler
03.13.12