Lab 10: Atomic Spectra
Archie Wheeler
Michael McMearty
Mateja Plantak
04.08.2012
A pdf version of this lab may downloaded here.
The doc version of this lab may be downloaded here.
The prelab may be downloaded here.
Abstract
Electrons that move jump up and down to different electrical shells release energy in the form of light. Using the Bohr model, we can accurately model and predict what these wavelengths will be for these different jumps.
In this lab, we used what we know of the atomic spectrum and light to determine wave lengths of bright emission lines of various elements. We also used our experimental setup to attempt to confirm the Rydberg constant.
This has been one of our most successful labs. Most of our error was only off by about 1 or 2% when we used objective ways of measuring (getting numerical values from the computer rather from our own judgment.)
Contents
Objectives
- To determine the wave lengths of the bright emission lines of hydrogen.
- To test the relationship between wavelength and energy as implied by the Bohr model.
- To determine the value of the Rydberg constant.
- To observe and describe the more complex spectra of other atoms including the doublet structure of sodium lines and to identify the atomic species of three unknown sources.
Setup
Materials:- Spectroscope platform and lab jack
- Grating post and diffraction grating
- Hydrogen geissler tube light source
- Other geissler tube light sources
- Mercury light source
- Sodium light source
- Unknown sources
- Ocean Optics Spectrometer
- Winsco Spectrum Analysis chart
- Graphical Analysis software
Methods
Part 1. Patterns caused by diffraction gratings
We inserted the hydrogen tube into the power supply and established an electric current through it. We set the spectroscope platform in front of the light source so that the slit was at the center of the Geisler tube. We aligned the grating on the grating post and put the grating post into the hole on the platform. We measured and recorded the distance D between the grating and the slit.
Using the diffraction grating, we read and recorded the position x of the red hydrogen line (m=3) and put the value in a table. We computed and recorded the average value of θ and calculated the wavelength using the following equation:

We compared this with the accepted value and repeated the process for blue (m=4) and violet (m=5) light.

Our setup for part 1
Part 2. Hydrogen spectrum
We used the Ocean Optics Sectrometer and Spectra Suite software to record the hydrogen spectrum, and to record the wavelengths af the transitions from the m=6, m=7, and m=8 values to the n=2 level.
We completed the table given to us by the lab wiki and constructed a plot of y=1/λ vs. x=1/m2 using our experimental values. From the graph, we were able to use the slope to determine the value of the Rydberg constant (R = -m) and determined the percentage error from the accepted value of 1.09678*107m-1. From the y intercept, we were able to show that n=2.
Part 3. Helium Spectrum
Using the Star Spectroscope, we observed the visible lines of Helium and recorded the color, energy, and wavelength of each of these lines, and determined whether any of these lines could have been the result of a transition in singly ionized Helium. We calculated the energies in electron volts and the wavelengths of the visible lines in the spectrum. We determined which the wavelengths seen in the Ocean Optics spectrometer were closest to the lines in the visible region and determined the initial and final states of the transition. In all of this, we kept in mind that RHe= 4RH=4.387*107m-1

Our setup for part 1
Part 4. Spectrum of other light sources
We used two other Geisler tubes, fluorescent lights, and tungsten filaments through the spectroscope and compared qualitatively our observations of the spectra with that of hydrogen. We also evaluated whether these spectra could fit the following equation:


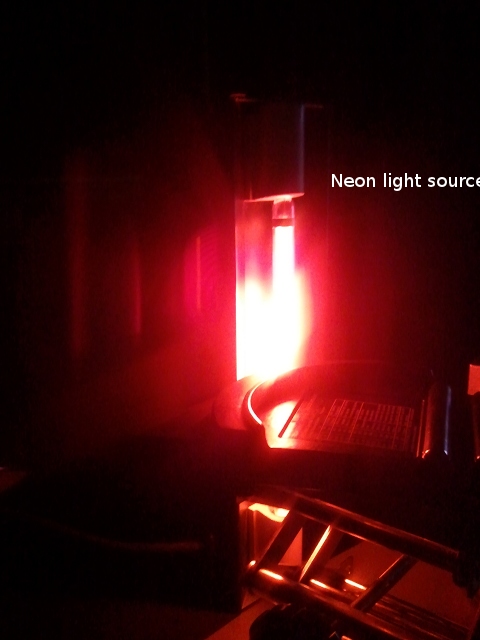
Our setup for the neon light source

Our setup for the xenon light source
Part 5. Sodium and Mercury light sources
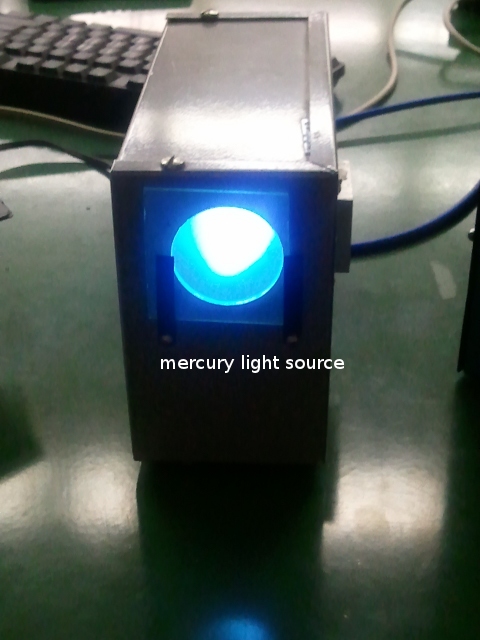
Using the Project Star Spectrometer shown in the following figure, we observed the sodium light source and the mercury light source and recorded the color and wave lengths of the bright lines.

We also tried to come up with an explanation as to why all of the Ocean Optics sodium lines were double. We compared our observations with the values shown on the lab wiki.

Our setup the sodium light source

Our setup for the mercury light source
Part 6. Fraunhofer absorption lines
We directed the Project Star Spectrometer out of the window in HYH219 with no lights on within the room. We recorded the wavelengths of the four darkest of the Fraunhofer absorption lines in a table, and attempted to identify all of the lines.
Data and Analysis
Part 1. Patterns caused by diffraction gratings 14:48
| m | color | Position R(m) | θ | λexp(nm) | λthe(nm) | Percent Error |
|---|---|---|---|---|---|---|
| 3 | red | 0.170 | 0.34 | 666 | 657 | 1.60% |
| 4 | blue | 0.125 | 0.25 | 495 | 486 | 1.75% |
| 5 | violet | 0.115 | 0.23 | 456 | 434 | 5.01% |
D = 0.50m
All of our error in this part was very reasonable. It is most likely that this was due to an error in estimating what value the band was at. A misjudgment of only a few nanometers would be enough to give us a few percent error, which is what we experienced.
Part 2. Hydrogen spectrum
| m | λthe(nm) | λexp(nm) | Percent Error |
|---|---|---|---|
| 3 | 656.5 | 656 | 0.08% |
| 4 | 486.3 | 486 | 0.06% |
| 5 | 434.2 | 434 | 0.05% |
| 6 | 410.3 | 410 | 0.07% |
| 7 | 397.1 | 397 | 0.03% |
| 8 | 389.0 | 389 | 0.00% |

1/λ vs. 1/m^2.

The opposite of the slope and the Rydberg Constant only differ by .13% and the value of n by .06% The error in this part of the lab was quite low. The percent error in this part was due purely to roundoff errors.
Part 3. Helium Spectrum 15:40
| color | m | n | Eexp(eV) | Ethe(eV) | %ErrorE | λexp(nm) | λthe(nm) | %Errorλ |
|---|---|---|---|---|---|---|---|---|
| red 1 | 11 | 5 | 1.75 | 1.73 | 1.38% | 717 | 718 | 0.18% |
| red 2 | 13 | 5 | 1.85 | 1.85 | 0.21% | 669 | 669 | 0.03% |
| yellow | 6 | 4 | 2.11 | 1.89 | 11.72% | 589 | 656 | 10.28% |
| green | 7 | 4 | 2.47 | 2.29 | 7.89% | 501 | 542 | 7.49% |
| cyan | 8 | 4 | 2.52 | 2.55 | 1.16% | 492 | 486 | 1.18% |
| dark blue | 9 | 4 | 2.77 | 2.73 | 1.54% | 448 | 454 | 1.43% |
| blue | 11 | 4 | 2.63 | 2.95 | 10.85% | 421 | 420 | 0.17% |
The largest source of error this part was struggling to find m and n values for the energy shifts. Some values seemed to match up very nicely, and other values did not seem to be anywhere near where they should have been. We tried our best, but these are the best values we could come up with.
Part 4. Spectrum of other light sources
Neon has quite a few lines in the red-orange-yellow range but there were no lines in the green-blue-violet range. Hydrogen had fewer total lines but they were more evenly distributed.
Xenon's lines were fainter than hydrogen's. We could barely make out faint light in the blue cyan range. After looking at it again more closely, we were able to see a faint full range.
The lines are within the visible spectrum, but do not seem to follow the same pattern that hydrogen does. Thus, they probably require a slightly more complicated equation, since the Bohr model that the equation is based off of only is true for Hydrogen.
Part 5. Sodium and Mercury light sources
Sodium| color | λexp | λthe | %Error |
|---|---|---|---|
| red | 617 | 616.1 | 0.15% |
| -- | 615.4 | N/A | |
| yellow | 591 | 598.6 | 1.27% |
| -- | 589.0 | N/A | |
| green | 569 | 568.8 | 0.04% |
| -- | 568.3 | N/A | |
| emerald | 517 | 515.4 | 0.31% |
| -- | 514.9 | N/A | |
| cyan | 499 | 498.3 | 0.14% |
| -- | 497.9 | N/A | |
| -- | 475.2 | N/A | |
| violet | 478 | 474.8 | 0.67% |
| -- | 466.9 | N/A | |
| -- | 466.5 | N/A | |
| -- | 449.8 | N/A | |
| -- | 449.4 | N/A |
| color | λexp | λthe | %Error |
|---|---|---|---|
| yellow 1 | 579 | 579.1 | 0.02% |
| yellow 2 | 576 | 579.0 | 0.52% |
| green | 545 | 546.1 | 0.20% |
| blue | 435 | 435.8 | 0.18% |
| violet | 405 | -- | N/A |
The error in this part of the lab was quite low. Most likely due to an inability on our part to calibrate the spectrometers perfectly or to record the exact value of the wavelength on a sensitive scale.
Part 6. Fraunhofer absorption lines 15:30
| Wavelength(nm) | Element | Fraunhofer Line |
|---|---|---|
| 432 | Fe & Ca | G |
| 488 | H | F |
| 591 | Na | D |
| 657 | H | C |
Conclusion
The lab was a success. The Bohr model was proven to be a wonderful way to predict the energy given by electron jumps in the hydrogen atom. The Rydberg constant was also experimentally confirmed. We were able to observe other elements and conclude that Bohr's model is not sufficient to explain them by itself (a conclusion already supported by most modern physicists).
If there was any error in this lab, it was mostly our inability to calibrate the hand-held spectroscopes and to get a reading off of them (a few millimeters on the scale meant the difference of 5 or 10% error. I believe that this has been one of our most accurate labs, and has successfully fulfilled all of the objectives.
Signature

Archie Wheeler
03.26.12